.avif)
Lead Generation Metrics That Actually Predict Revenue
Lead generation metrics are the numbers that show which lead generation efforts are bringing in qualified leads, moving them through the funnel, and turning them into revenue. Most teams track the wrong numbers. They watch hundreds of leads pour in and celebrate. Then three months later, revenue flatlines and nobody knows why.
The truth is simple: volume doesn't mean anything if the quality is garbage. A lead generation system without the right metrics is like driving cross-country with a broken speedometer and no GPS. You're moving, but you have no idea if you're headed the right way or about to run out of gas.
This guide breaks down the lead generation metrics that actually matter, how to track them without drowning in spreadsheets, and what the numbers are telling you about your sales system.
The Problem with Vanity Metrics
Here's the thing: most lead generation metrics make you feel good but don't make you money. Total leads generated. Impressions. Clicks. Website visits. These numbers look impressive in a report, but they don't pay the bills.
A 30-person consulting firm can generate 500 leads a month and close zero deals if those leads are junk. We see this all the time with new clients who come in celebrating massive lead volume, then quietly admit their sales team hates the list.
The real question isn't "how many leads did we get?" It's "how many of these leads can actually buy, and how many will?"
What Makes a Metric Actually Useful
A good lead generation metric connects directly to revenue. It tells you what's broken in your system and where to fix it. It answers one of three questions:
- Are we talking to the right people?
- Are enough of them interested?
- Are they turning into paying clients?
If a metric doesn't help you answer those questions, stop tracking it. Your time is better spent elsewhere.
The Metrics That Don't Matter (Stop Tracking These)
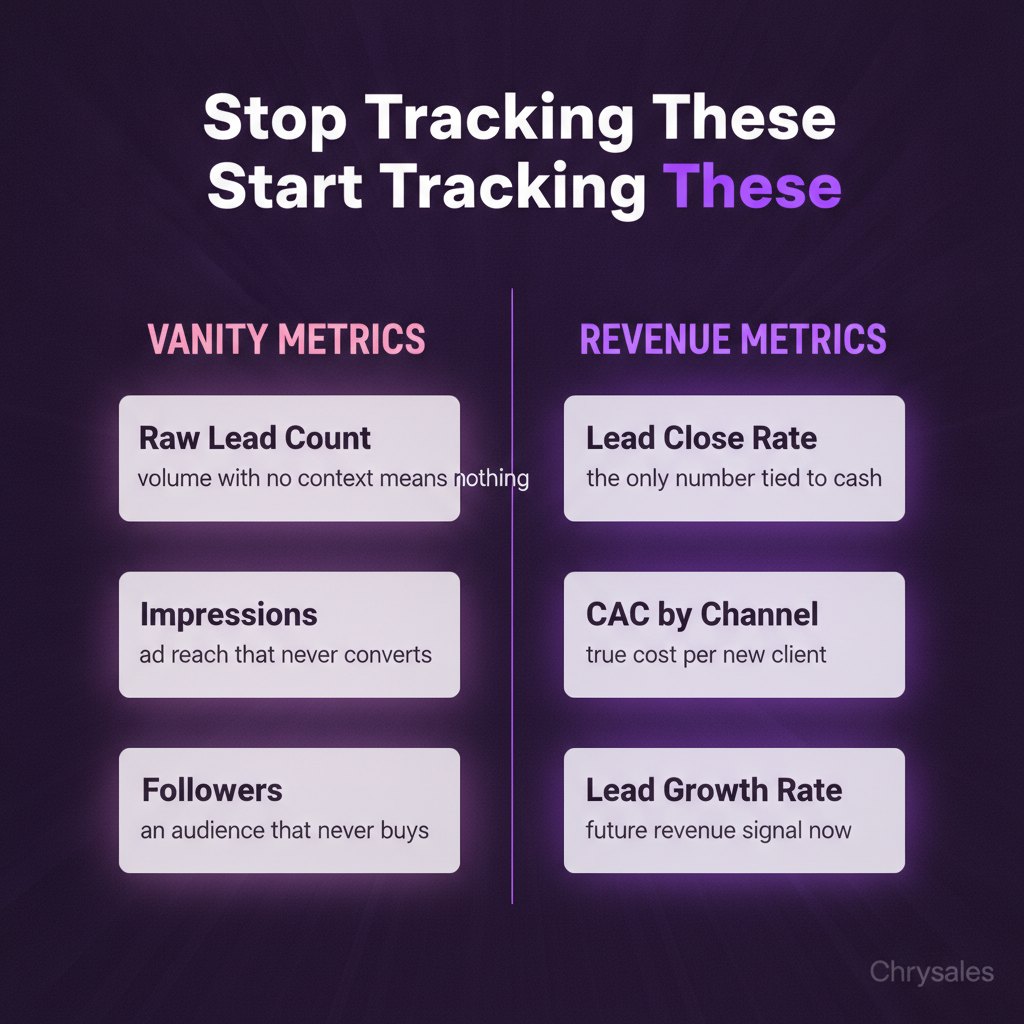
Raw lead count without context means nothing. Cost per impression tells you about ad performance, not sales performance. Social media followers, unless they're booking calls, are just an audience watching from the sidelines.
Common mistake: Teams obsess over lowering cost per lead while ignoring that cheaper leads often convert worse. A lead that costs €20 and closes 10% of the time is better than a lead that costs €5 and closes 1% of the time. Do the math.
Cost Per Lead: What It Really Tells You
Cost per lead is the price you pay to get one person into your pipeline. Divide your total lead generation spend by the number of leads generated. If you spent €3,000 on ads and got 150 leads, your cost per lead is €20.
This number matters, but only if you pair it with conversion data. A low cost per lead means nothing if those leads never close.
How to Calculate It Right
Take every dollar you spend on lead generation: ads, tools, list building, copywriting, design, outreach software. Add it all up. Divide by the number of qualified leads (not just anyone who filled out a form). That's your real cost per lead.
Most teams forget to include tool costs, freelancer fees, and internal time. A more honest calculation might double the number you first calculated.
When Cost Per Lead Actually Matters
Cost per lead helps you compare channels. If cold email generates leads at €15 each and LinkedIn ads generate them at €80 each, but both convert at the same rate, the choice is obvious.
It also tells you when a channel is getting expensive. If your cost per lead on a channel jumps 40% in a month, something changed. Maybe ad costs went up, maybe your targeting got worse, maybe your offer stopped working.
Pro Tip: Track cost per lead by channel, not as one blended number. Blended averages hide which channels are working and which are bleeding money.
Lead Conversion Rate: The Number That Matters Most
Lead conversion rate is the percentage of leads that turn into paying clients. If you generated 200 leads and closed 10 deals, your lead conversion rate is 5%.
This is the metric that actually predicts revenue. You can control cost per lead by spending more or less. You can't fake conversion rate. It tells you if your leads are good and if your sales process works.
Breaking Down the Funnel
Lead conversion happens in stages. Not every lead is ready to buy. Most B2B sales systems break it down like this:
Raw lead → Marketing Qualified Lead (MQL) → Sales Qualified Lead (SQL) → Opportunity → Closed Deal
Each stage has a conversion rate. If 200 raw leads turn into 80 MQLs, that's a 40% MQL conversion rate. If 80 MQLs turn into 30 SQLs, that's a 37.5% SQL conversion rate. If 30 SQLs turn into 6 closed deals, that's a 20% close rate.
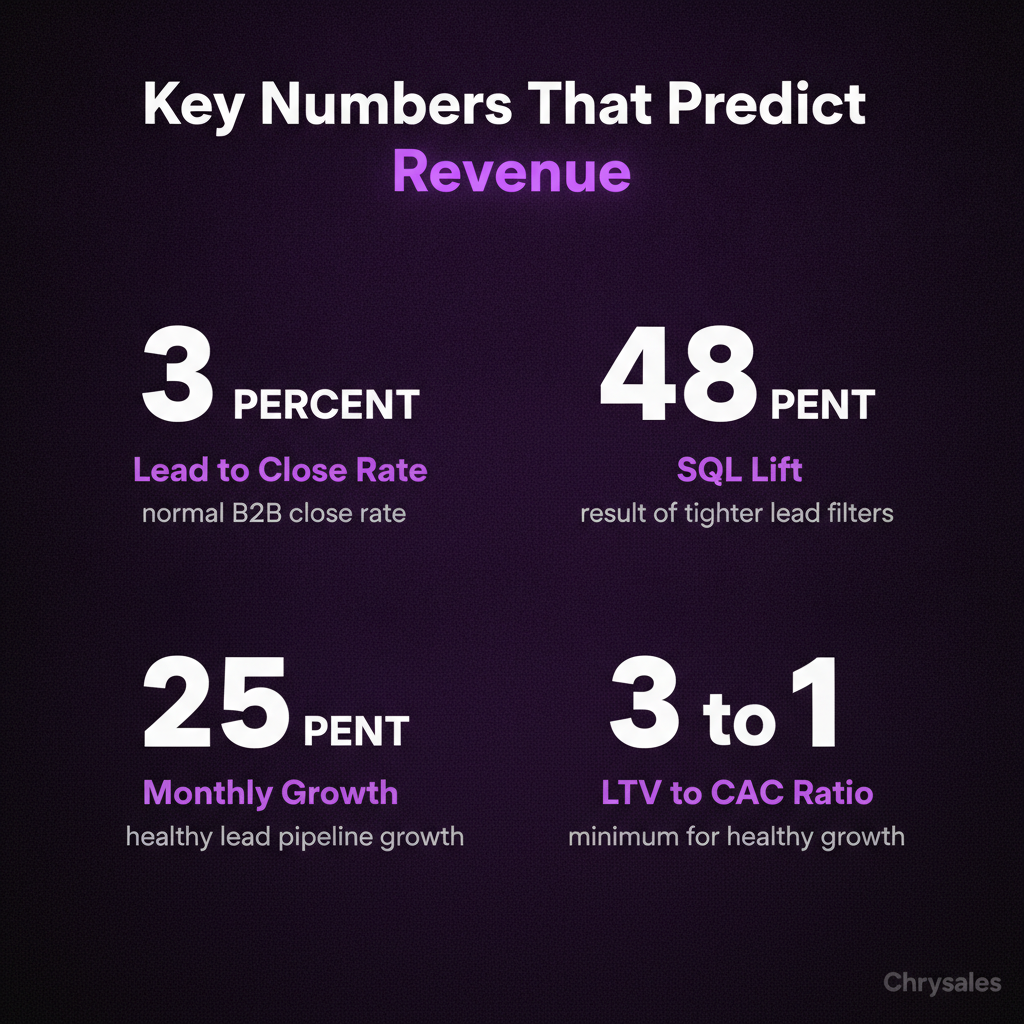
Multiply those together and you get your overall lead conversion rate: 3%. That's realistic for most B2B lead generation systems. If someone promises you 20% lead to close rates, they're either lying or working in a completely different market.
What Good Looks Like
B2B lead generation benchmarks vary wildly by industry, deal size, and sales cycle length. Research on B2B sales statistics shows a rough guide:
- 2-5% lead to close rate: normal for most B2B
- 5-10%: strong, well qualified pipeline
- Above 10%: either very tight targeting or very small sample size
A 15-person consulting firm selling €50,000 contracts should expect lower conversion than a marketing agency selling €5,000 retainers. Longer sales cycles and higher prices mean fewer conversions but bigger deals.
Watch out: If your lead conversion rate is above 15%, your lead volume is probably too low or your definition of "lead" is too tight. Widen the top of your funnel.
MQL to SQL Conversion: The Quality Check
Marketing Qualified Leads are people who match your ideal customer profile and showed some interest. They downloaded something, filled out a form, replied to an email.
Sales Qualified Leads are people your sales team actually wants to talk to because they have budget, authority, need, and timing.
The gap between MQL and SQL is where most pipelines fall apart.
Why This Metric Exposes Bad Lists
If 100 MQLs turn into 10 SQLs, your MQL definition is broken. You're letting in too many people who can't buy or won't buy.
This happens when lead magnets attract the wrong audience, when ads target job titles instead of real decision power, or when list providers sell you garbage data.
One marketing agency we worked with had a 12% MQL to SQL conversion rate. After tightening their lead criteria (company size, recent funding, tech stack signals), it jumped to 48%. Same outreach, better list.
How to Improve It
Tighten your MQL criteria. Add qualification questions to your forms. Score leads based on fit, not just activity. Stop counting every email reply as a qualified lead.
Use real signals: company revenue, employee count, tech stack, recent hires, funding rounds, job postings. A 200-person company that just raised a Series B and is hiring account executives is a better lead than a 10-person company with no funding and a founder doing all the sales.
You can also watch 4 Ways To Find Clients Who Need Your Services Right Now for practical targeting strategies that improve lead quality.
Pro Tip: Run a monthly audit. Pull 20 random MQLs and check if they actually fit your ideal customer profile. If more than 30% don't, your criteria are too loose.
Pipeline Velocity: How Fast Leads Move
Pipeline velocity measures how long it takes a lead to move through your funnel and close. It's measured in days, and the faster it is, the better your cash flow.
Calculate it by tracking the average time from first contact to closed deal. If it takes 45 days on average, that's your pipeline velocity.
Why Slow Pipelines Kill Growth
A slow pipeline ties up your sales team's time and drags out revenue. If every deal takes 90 days to close, you need three months of runway to see results from any new lead generation effort.
Fast pipelines let you test, learn, and adjust quickly. Small sales teams especially need fast pipelines. A three person sales team can't afford to nurture 100 leads for six months. They need deals closing in 30 to 45 days or the business runs out of money.
What Slows Down a Pipeline
Long sales cycles usually mean one of three things: your leads aren't urgent, your offer isn't clear, or your sales process has too many steps.
We worked with a tech company whose average deal took 120 days. After mapping the process, we found 11 touchpoints between first call and contract signature. We cut it to 5 touchpoints and got the cycle down to 52 days. Same leads, same offer, half the time.
If you're looking to streamline your entire process, check out our guide on how to build sales pipeline that moves leads efficiently through each stage.
Common mistake: Adding more follow up emails and more nurture sequences to "fix" a slow pipeline. Most of the time, slow pipelines need fewer steps, not more touches.
Response Rate and Reply Rate for Outbound
If you're doing cold outreach (email, LinkedIn, calls), response rate and reply rate are your early warning system. They tell you if your message is landing before you waste weeks waiting for meetings.
Response rate is the percentage of people who reply to your outreach. Reply rate is usually used for email specifically. If you sent 500 cold emails and got 20 replies, your reply rate is 4%.
Outbound Benchmarks That Are Actually Real
Cold email reply rates for B2B:
- 1-2%: bad (list is off, message is generic, or both)
- 3-5%: decent, workable
- 5-8%: strong
- Above 8%: either very tight targeting or a small sample
Cold calling connect rates:
- 5-10%: normal (you actually get someone on the phone)
- 2-5% of connects turn into meetings: typical
LinkedIn outreach:
- 20-40% connection acceptance rate
- 5-10% reply rate after connection
Watch out: High reply rates don't always mean good replies. If 10% of people reply but most say "not interested," your targeting is still broken.
How to Improve Response Rates
Better lists beat better copy almost every time. A perfect email to the wrong person gets ignored. A decent email to the right person at the right time gets a meeting.
Personalize the first line. Reference something real about their company. Make the ask small (a 15 minute call, not a 60 minute demo). Don't pitch in the first message.
For a deeper dive into tactics that actually work, read our complete breakdown of outbound email marketing best practices to optimize every element of your cold outreach.
A 30-person consulting firm tried this last quarter: instead of blasting 1,000 generic emails, they sent 200 highly personalized ones. Reply rate jumped from 2% to 9%, and they booked 12 new calls in three weeks.
Customer Acquisition Cost (CAC): The Full Picture
Customer Acquisition Cost is the total cost to acquire one paying customer. It includes everything: ad spend, tools, salaries, software, content creation, freelancers.
Divide all of that by the number of new customers you closed. If you spent €20,000 on lead generation and sales in a month and closed 10 customers, your CAC is €2,000.
Why CAC Is the Truth Teller
CAC tells you if your business model works. If it costs you €5,000 to acquire a customer and their lifetime value is €6,000, you're running on fumes. If it costs €2,000 and their lifetime value is €20,000, you can scale aggressively.
Most teams only count ad spend when calculating CAC. That's wrong. Add in:
- Salaries for sales and marketing people
- Software and tools (CRM, email tools, ad platforms)
- Freelancers and agencies
- Content and design costs
- Lead list purchases
The real number is usually 2 to 3x higher than what teams first calculate.
The CAC to LTV Ratio
Lifetime Value (LTV) is how much revenue one customer brings in over their entire relationship with you. The ratio of LTV to CAC tells you if your sales system is healthy.
- LTV:CAC ratio of 1:1 → you're losing money
- 2:1 → breakeven or small profit, not sustainable
- 3:1 → healthy, room to grow
- 5:1 or higher → very strong, scale aggressively
Growing B2B companies should aim for 3:1 or better. If you're below that, either lower CAC or increase LTV (higher prices, longer retention, upsells).
Pro Tip: Calculate CAC by channel. Your LinkedIn ads might have a €3,000 CAC while your cold email has a €800 CAC. Stop spending on the expensive channel and double down on the cheap one.
Lead Velocity Rate: The Growth Indicator
Lead Velocity Rate (LVR) measures how fast your qualified lead pipeline is growing month over month. It's a growth metric, not a conversion metric.
Calculate it like this: ((This month's qualified leads - Last month's qualified leads) / Last month's qualified leads) x 100.
If you had 80 qualified leads last month and 100 this month, your LVR is 25%. Your pipeline grew by a quarter.
Why LVR Predicts Future Revenue
Revenue is a lagging indicator. It tells you what happened 30, 60, or 90 days ago. Lead Velocity Rate is a leading indicator. It tells you what revenue will look like next month or next quarter.
If your LVR is climbing, revenue will follow. If it's dropping, revenue will drop in a few weeks. This gives you time to fix things before you run out of cash.
One tech company tracked LVR weekly. When it dipped below 10% for two weeks straight, they knew they had a problem. They ramped up cold outreach, and LVR bounced back to 22% within a month. Revenue stayed stable because they caught it early.
What Moves LVR Up or Down
More lead generation activity pushes LVR up. Better targeting pushes it up. New channels push it up.
Seasonal slowdowns, bad lists, broken outreach, or sales team capacity limits push it down.
If LVR is falling, dig into the funnel. Are fewer raw leads coming in? Are leads getting disqualified faster? Is the sales team too busy to follow up?
Setting Up a Simple Lead Gen Dashboard
Most teams drown in data or track nothing at all. A good lead generation dashboard has 6 to 8 metrics max, updated weekly.
Here's a simple setup:
Top-of-Funnel Metrics:
- Raw leads generated
- Cost per lead by channel
- Response rate (for outbound)
Mid-Funnel Metrics:
- MQL to SQL conversion rate
- Pipeline velocity (days to close)
Bottom-Funnel Metrics:
- Lead conversion rate (lead to close)
- Customer Acquisition Cost
- Lead Velocity Rate (month over month growth)
Track these in a simple spreadsheet or your CRM. Update them every Monday. If a number moves more than 20% in either direction, dig in and figure out why.
For a comprehensive approach to tracking these metrics within your overall sales framework, explore our guide on B2B sales pipeline management and how to organize your dashboard for maximum insight.
Common mistake: Building a 40 metric dashboard that nobody looks at. Keep it simple. Eight numbers you check every week beat 40 numbers you ignore.
How Often to Review Metrics
Weekly reviews catch problems early. Monthly reviews show trends. Quarterly reviews tell you if your entire lead generation strategy is working.
In weekly reviews, look for sudden drops or spikes. If reply rates fall from 5% to 2%, something broke. If cost per lead doubles, check your targeting.
In monthly reviews, look at growth trends. Is MQL to SQL conversion improving? Is pipeline velocity getting faster? Is CAC going up or down?
In quarterly reviews, decide what to keep and what to kill. If a channel has had a 10:1 CAC to LTV ratio for three months, scale it. If another channel has been stuck at 1:1 for three months, kill it.
Using Metrics to Fix What's Broken
Metrics are useless unless they change what you do. Here's how to use the numbers as a diagnostic tool.
Problem: High lead volume, low conversions
Check MQL to SQL conversion. If it's under 20%, your list quality is bad. Tighten targeting. Add qualification questions. Stop buying cheap leads.
Problem: Good conversions, slow pipeline
Check pipeline velocity. If deals take 90+ days, map every step in your sales process. Cut unnecessary meetings, simplify your proposal process, remove approval bottlenecks.
Problem: Decent metrics, no growth
Check Lead Velocity Rate. If it's flat or negative, you're not generating enough new qualified leads. Add a new channel, increase outreach volume, or improve targeting to boost lead quality.
Problem: High CAC, low profitability
Compare CAC by channel. Kill the expensive channels. Double down on the cheap ones. If all channels are expensive, either your offer is weak or your targeting is too broad.
Picture this: you spend two weeks perfecting your cold email copy, but your reply rate stays at 1%. The problem isn't the words. It's the list. Metrics tell you where to focus.
Most teams guess. Good systems measure. If you want to build a system that scales predictably, watch How To Build a Sales System So Powerful Clients Come To You for a complete walkthrough of creating measurable, repeatable sales processes.
Frequently Asked Questions
Q: What's the most important lead generation metric to track first?
Lead conversion rate (lead to close). It's the only metric that directly predicts revenue. You can have great cost per lead, high response rates, and fast pipeline velocity, but if leads don't close, none of it matters. Start there. If your conversion rate is under 3%, fix your targeting or your sales process before worrying about anything else. Once conversion is solid, add cost per lead and MQL to SQL conversion to get the full picture.
Q: How long should I track metrics before making changes?
At least two weeks for outbound response rates, four weeks for conversion metrics. Don't panic after three days of bad numbers. Small sample sizes lie. If you sent 50 emails and got zero replies, that could just be bad luck. If you sent 500 and got zero replies, your message or list is broken. Wait until you have at least 200 to 300 data points before changing strategy. The exception: if something is obviously broken (5% of your list bounces, your ads got disapproved), fix it immediately.
Q: Should I track different metrics for different lead generation channels?
Yes. Cold email, paid ads, LinkedIn outreach, and referrals all need different metrics. For cold email, track reply rate and meeting booked rate. For paid ads, track cost per lead and lead quality score. For LinkedIn, track connection acceptance rate and response rate. For referrals, track referral to close rate. Blending them into one number hides what's working. Build a simple dashboard with one section per channel. Review weekly to see which channels deliver the best leads at the lowest cost.
Q: What's a realistic lead to close conversion rate for B2B?
Most B2B companies see 2 to 5% overall lead to close rates, according to current B2B sales statistics and benchmarks. If you're selling high ticket services (above €20,000), expect closer to 2 to 3%. Lower ticket B2B offers (under €10,000) can hit 5 to 8% with tight targeting. If you're above 10%, you either have incredible product market fit or your lead volume is too small. If you're below 2%, your leads are probably low quality or your sales process needs work. Focus on tightening your MQL criteria and improving how your sales team qualifies leads before jumping on calls.
Q: How do I calculate Customer Acquisition Cost if I have a small team?
Add up everything you spend on sales and marketing in a month: ad spend, software subscriptions (CRM, email tools, LinkedIn Sales Navigator), any freelancers or agencies, and a portion of your own salary if you're doing sales or marketing work. Divide that total by the number of new customers you closed that month. If you spent €5,000 total and closed 4 customers, your CAC is €1,250. Track this monthly. If CAC is climbing, figure out what changed. If it's falling, you found something that works and should do more of it.
Lead generation metrics are the numbers that show which lead generation efforts are bringing in qualified leads, moving them through the funnel, and turning them into revenue. Most teams track the wrong numbers. They watch hundreds of leads pour in and celebrate. Then three months later, revenue flatlines and nobody knows why.
The truth is simple: volume doesn't mean anything if the quality is garbage. A lead generation system without the right metrics is like driving cross-country with a broken speedometer and no GPS. You're moving, but you have no idea if you're headed the right way or about to run out of gas.
This guide breaks down the lead generation metrics that actually matter, how to track them without drowning in spreadsheets, and what the numbers are telling you about your sales system.
The Problem with Vanity Metrics
Here's the thing: most lead generation metrics make you feel good but don't make you money. Total leads generated. Impressions. Clicks. Website visits. These numbers look impressive in a report, but they don't pay the bills.
A 30-person consulting firm can generate 500 leads a month and close zero deals if those leads are junk. We see this all the time with new clients who come in celebrating massive lead volume, then quietly admit their sales team hates the list.
The real question isn't "how many leads did we get?" It's "how many of these leads can actually buy, and how many will?"
What Makes a Metric Actually Useful
A good lead generation metric connects directly to revenue. It tells you what's broken in your system and where to fix it. It answers one of three questions:
- Are we talking to the right people?
- Are enough of them interested?
- Are they turning into paying clients?
If a metric doesn't help you answer those questions, stop tracking it. Your time is better spent elsewhere.
The Metrics That Don't Matter (Stop Tracking These)
Raw lead count without context means nothing. Cost per impression tells you about ad performance, not sales performance. Social media followers, unless they're booking calls, are just an audience watching from the sidelines.
Common mistake: Teams obsess over lowering cost per lead while ignoring that cheaper leads often convert worse. A lead that costs €20 and closes 10% of the time is better than a lead that costs €5 and closes 1% of the time. Do the math.
Cost Per Lead: What It Really Tells You
Cost per lead is the price you pay to get one person into your pipeline. Divide your total lead generation spend by the number of leads generated. If you spent €3,000 on ads and got 150 leads, your cost per lead is €20.
This number matters, but only if you pair it with conversion data. A low cost per lead means nothing if those leads never close.
How to Calculate It Right
Take every dollar you spend on lead generation: ads, tools, list building, copywriting, design, outreach software. Add it all up. Divide by the number of qualified leads (not just anyone who filled out a form). That's your real cost per lead.
Most teams forget to include tool costs, freelancer fees, and internal time. A more honest calculation might double the number you first calculated.
When Cost Per Lead Actually Matters
Cost per lead helps you compare channels. If cold email generates leads at €15 each and LinkedIn ads generate them at €80 each, but both convert at the same rate, the choice is obvious.
It also tells you when a channel is getting expensive. If your cost per lead on a channel jumps 40% in a month, something changed. Maybe ad costs went up, maybe your targeting got worse, maybe your offer stopped working.
Pro Tip: Track cost per lead by channel, not as one blended number. Blended averages hide which channels are working and which are bleeding money.
Lead Conversion Rate: The Number That Matters Most
Lead conversion rate is the percentage of leads that turn into paying clients. If you generated 200 leads and closed 10 deals, your lead conversion rate is 5%.
This is the metric that actually predicts revenue. You can control cost per lead by spending more or less. You can't fake conversion rate. It tells you if your leads are good and if your sales process works.
Breaking Down the Funnel
Lead conversion happens in stages. Not every lead is ready to buy. Most B2B sales systems break it down like this:
Raw lead → Marketing Qualified Lead (MQL) → Sales Qualified Lead (SQL) → Opportunity → Closed Deal
Each stage has a conversion rate. If 200 raw leads turn into 80 MQLs, that's a 40% MQL conversion rate. If 80 MQLs turn into 30 SQLs, that's a 37.5% SQL conversion rate. If 30 SQLs turn into 6 closed deals, that's a 20% close rate.
Multiply those together and you get your overall lead conversion rate: 3%. That's realistic for most B2B lead generation systems. If someone promises you 20% lead to close rates, they're either lying or working in a completely different market.
What Good Looks Like
B2B lead generation benchmarks vary wildly by industry, deal size, and sales cycle length. Research on B2B sales statistics shows a rough guide:
- 2-5% lead to close rate: normal for most B2B
- 5-10%: strong, well qualified pipeline
- Above 10%: either very tight targeting or very small sample size
A 15-person consulting firm selling €50,000 contracts should expect lower conversion than a marketing agency selling €5,000 retainers. Longer sales cycles and higher prices mean fewer conversions but bigger deals.
Watch out: If your lead conversion rate is above 15%, your lead volume is probably too low or your definition of "lead" is too tight. Widen the top of your funnel.
MQL to SQL Conversion: The Quality Check
Marketing Qualified Leads are people who match your ideal customer profile and showed some interest. They downloaded something, filled out a form, replied to an email.
Sales Qualified Leads are people your sales team actually wants to talk to because they have budget, authority, need, and timing.
The gap between MQL and SQL is where most pipelines fall apart.
Why This Metric Exposes Bad Lists
If 100 MQLs turn into 10 SQLs, your MQL definition is broken. You're letting in too many people who can't buy or won't buy.
This happens when lead magnets attract the wrong audience, when ads target job titles instead of real decision power, or when list providers sell you garbage data.
One marketing agency we worked with had a 12% MQL to SQL conversion rate. After tightening their lead criteria (company size, recent funding, tech stack signals), it jumped to 48%. Same outreach, better list.
How to Improve It
Tighten your MQL criteria. Add qualification questions to your forms. Score leads based on fit, not just activity. Stop counting every email reply as a qualified lead.
Use real signals: company revenue, employee count, tech stack, recent hires, funding rounds, job postings. A 200-person company that just raised a Series B and is hiring account executives is a better lead than a 10-person company with no funding and a founder doing all the sales.
You can also watch 4 Ways To Find Clients Who Need Your Services Right Now for practical targeting strategies that improve lead quality.
Pro Tip: Run a monthly audit. Pull 20 random MQLs and check if they actually fit your ideal customer profile. If more than 30% don't, your criteria are too loose.
Pipeline Velocity: How Fast Leads Move
Pipeline velocity measures how long it takes a lead to move through your funnel and close. It's measured in days, and the faster it is, the better your cash flow.
Calculate it by tracking the average time from first contact to closed deal. If it takes 45 days on average, that's your pipeline velocity.
Why Slow Pipelines Kill Growth
A slow pipeline ties up your sales team's time and drags out revenue. If every deal takes 90 days to close, you need three months of runway to see results from any new lead generation effort.
Fast pipelines let you test, learn, and adjust quickly. Small sales teams especially need fast pipelines. A three person sales team can't afford to nurture 100 leads for six months. They need deals closing in 30 to 45 days or the business runs out of money.
What Slows Down a Pipeline
Long sales cycles usually mean one of three things: your leads aren't urgent, your offer isn't clear, or your sales process has too many steps.
We worked with a tech company whose average deal took 120 days. After mapping the process, we found 11 touchpoints between first call and contract signature. We cut it to 5 touchpoints and got the cycle down to 52 days. Same leads, same offer, half the time.
If you're looking to streamline your entire process, check out our guide on how to build sales pipeline that moves leads efficiently through each stage.
Common mistake: Adding more follow up emails and more nurture sequences to "fix" a slow pipeline. Most of the time, slow pipelines need fewer steps, not more touches.
Response Rate and Reply Rate for Outbound
If you're doing cold outreach (email, LinkedIn, calls), response rate and reply rate are your early warning system. They tell you if your message is landing before you waste weeks waiting for meetings.
Response rate is the percentage of people who reply to your outreach. Reply rate is usually used for email specifically. If you sent 500 cold emails and got 20 replies, your reply rate is 4%.
Outbound Benchmarks That Are Actually Real
Cold email reply rates for B2B:
- 1-2%: bad (list is off, message is generic, or both)
- 3-5%: decent, workable
- 5-8%: strong
- Above 8%: either very tight targeting or a small sample
Cold calling connect rates:
- 5-10%: normal (you actually get someone on the phone)
- 2-5% of connects turn into meetings: typical
LinkedIn outreach:
- 20-40% connection acceptance rate
- 5-10% reply rate after connection
Watch out: High reply rates don't always mean good replies. If 10% of people reply but most say "not interested," your targeting is still broken.
How to Improve Response Rates
Better lists beat better copy almost every time. A perfect email to the wrong person gets ignored. A decent email to the right person at the right time gets a meeting.
Personalize the first line. Reference something real about their company. Make the ask small (a 15 minute call, not a 60 minute demo). Don't pitch in the first message.
For a deeper dive into tactics that actually work, read our complete breakdown of outbound email marketing best practices to optimize every element of your cold outreach.
A 30-person consulting firm tried this last quarter: instead of blasting 1,000 generic emails, they sent 200 highly personalized ones. Reply rate jumped from 2% to 9%, and they booked 12 new calls in three weeks.
Customer Acquisition Cost (CAC): The Full Picture
Customer Acquisition Cost is the total cost to acquire one paying customer. It includes everything: ad spend, tools, salaries, software, content creation, freelancers.
Divide all of that by the number of new customers you closed. If you spent €20,000 on lead generation and sales in a month and closed 10 customers, your CAC is €2,000.
Why CAC Is the Truth Teller
CAC tells you if your business model works. If it costs you €5,000 to acquire a customer and their lifetime value is €6,000, you're running on fumes. If it costs €2,000 and their lifetime value is €20,000, you can scale aggressively.
Most teams only count ad spend when calculating CAC. That's wrong. Add in:
- Salaries for sales and marketing people
- Software and tools (CRM, email tools, ad platforms)
- Freelancers and agencies
- Content and design costs
- Lead list purchases
The real number is usually 2 to 3x higher than what teams first calculate.
The CAC to LTV Ratio
Lifetime Value (LTV) is how much revenue one customer brings in over their entire relationship with you. The ratio of LTV to CAC tells you if your sales system is healthy.
- LTV:CAC ratio of 1:1 → you're losing money
- 2:1 → breakeven or small profit, not sustainable
- 3:1 → healthy, room to grow
- 5:1 or higher → very strong, scale aggressively
Growing B2B companies should aim for 3:1 or better. If you're below that, either lower CAC or increase LTV (higher prices, longer retention, upsells).
Pro Tip: Calculate CAC by channel. Your LinkedIn ads might have a €3,000 CAC while your cold email has a €800 CAC. Stop spending on the expensive channel and double down on the cheap one.
Lead Velocity Rate: The Growth Indicator
Lead Velocity Rate (LVR) measures how fast your qualified lead pipeline is growing month over month. It's a growth metric, not a conversion metric.
Calculate it like this: ((This month's qualified leads - Last month's qualified leads) / Last month's qualified leads) x 100.
If you had 80 qualified leads last month and 100 this month, your LVR is 25%. Your pipeline grew by a quarter.
Why LVR Predicts Future Revenue
Revenue is a lagging indicator. It tells you what happened 30, 60, or 90 days ago. Lead Velocity Rate is a leading indicator. It tells you what revenue will look like next month or next quarter.
If your LVR is climbing, revenue will follow. If it's dropping, revenue will drop in a few weeks. This gives you time to fix things before you run out of cash.
One tech company tracked LVR weekly. When it dipped below 10% for two weeks straight, they knew they had a problem. They ramped up cold outreach, and LVR bounced back to 22% within a month. Revenue stayed stable because they caught it early.
What Moves LVR Up or Down
More lead generation activity pushes LVR up. Better targeting pushes it up. New channels push it up.
Seasonal slowdowns, bad lists, broken outreach, or sales team capacity limits push it down.
If LVR is falling, dig into the funnel. Are fewer raw leads coming in? Are leads getting disqualified faster? Is the sales team too busy to follow up?
Setting Up a Simple Lead Gen Dashboard
Most teams drown in data or track nothing at all. A good lead generation dashboard has 6 to 8 metrics max, updated weekly.
Here's a simple setup:
Top-of-Funnel Metrics:
- Raw leads generated
- Cost per lead by channel
- Response rate (for outbound)
Mid-Funnel Metrics:
- MQL to SQL conversion rate
- Pipeline velocity (days to close)
Bottom-Funnel Metrics:
- Lead conversion rate (lead to close)
- Customer Acquisition Cost
- Lead Velocity Rate (month over month growth)
Track these in a simple spreadsheet or your CRM. Update them every Monday. If a number moves more than 20% in either direction, dig in and figure out why.
For a comprehensive approach to tracking these metrics within your overall sales framework, explore our guide on B2B sales pipeline management and how to organize your dashboard for maximum insight.
Common mistake: Building a 40 metric dashboard that nobody looks at. Keep it simple. Eight numbers you check every week beat 40 numbers you ignore.
How Often to Review Metrics
Weekly reviews catch problems early. Monthly reviews show trends. Quarterly reviews tell you if your entire lead generation strategy is working.
In weekly reviews, look for sudden drops or spikes. If reply rates fall from 5% to 2%, something broke. If cost per lead doubles, check your targeting.
In monthly reviews, look at growth trends. Is MQL to SQL conversion improving? Is pipeline velocity getting faster? Is CAC going up or down?
In quarterly reviews, decide what to keep and what to kill. If a channel has had a 10:1 CAC to LTV ratio for three months, scale it. If another channel has been stuck at 1:1 for three months, kill it.
Using Metrics to Fix What's Broken
Metrics are useless unless they change what you do. Here's how to use the numbers as a diagnostic tool.
Problem: High lead volume, low conversions
Check MQL to SQL conversion. If it's under 20%, your list quality is bad. Tighten targeting. Add qualification questions. Stop buying cheap leads.
Problem: Good conversions, slow pipeline
Check pipeline velocity. If deals take 90+ days, map every step in your sales process. Cut unnecessary meetings, simplify your proposal process, remove approval bottlenecks.
Problem: Decent metrics, no growth
Check Lead Velocity Rate. If it's flat or negative, you're not generating enough new qualified leads. Add a new channel, increase outreach volume, or improve targeting to boost lead quality.
Problem: High CAC, low profitability
Compare CAC by channel. Kill the expensive channels. Double down on the cheap ones. If all channels are expensive, either your offer is weak or your targeting is too broad.
Picture this: you spend two weeks perfecting your cold email copy, but your reply rate stays at 1%. The problem isn't the words. It's the list. Metrics tell you where to focus.
Most teams guess. Good systems measure. If you want to build a system that scales predictably, watch How To Build a Sales System So Powerful Clients Come To You for a complete walkthrough of creating measurable, repeatable sales processes.
Frequently Asked Questions
Q: What's the most important lead generation metric to track first?
Lead conversion rate (lead to close). It's the only metric that directly predicts revenue. You can have great cost per lead, high response rates, and fast pipeline velocity, but if leads don't close, none of it matters. Start there. If your conversion rate is under 3%, fix your targeting or your sales process before worrying about anything else. Once conversion is solid, add cost per lead and MQL to SQL conversion to get the full picture.
Q: How long should I track metrics before making changes?
At least two weeks for outbound response rates, four weeks for conversion metrics. Don't panic after three days of bad numbers. Small sample sizes lie. If you sent 50 emails and got zero replies, that could just be bad luck. If you sent 500 and got zero replies, your message or list is broken. Wait until you have at least 200 to 300 data points before changing strategy. The exception: if something is obviously broken (5% of your list bounces, your ads got disapproved), fix it immediately.
Q: Should I track different metrics for different lead generation channels?
Yes. Cold email, paid ads, LinkedIn outreach, and referrals all need different metrics. For cold email, track reply rate and meeting booked rate. For paid ads, track cost per lead and lead quality score. For LinkedIn, track connection acceptance rate and response rate. For referrals, track referral to close rate. Blending them into one number hides what's working. Build a simple dashboard with one section per channel. Review weekly to see which channels deliver the best leads at the lowest cost.
Q: What's a realistic lead to close conversion rate for B2B?
Most B2B companies see 2 to 5% overall lead to close rates, according to current B2B sales statistics and benchmarks. If you're selling high ticket services (above €20,000), expect closer to 2 to 3%. Lower ticket B2B offers (under €10,000) can hit 5 to 8% with tight targeting. If you're above 10%, you either have incredible product market fit or your lead volume is too small. If you're below 2%, your leads are probably low quality or your sales process needs work. Focus on tightening your MQL criteria and improving how your sales team qualifies leads before jumping on calls.
Q: How do I calculate Customer Acquisition Cost if I have a small team?
Add up everything you spend on sales and marketing in a month: ad spend, software subscriptions (CRM, email tools, LinkedIn Sales Navigator), any freelancers or agencies, and a portion of your own salary if you're doing sales or marketing work. Divide that total by the number of new customers you closed that month. If you spent €5,000 total and closed 4 customers, your CAC is €1,250. Track this monthly. If CAC is climbing, figure out what changed. If it's falling, you found something that works and should do more of it.
Scaling Is Not Hard If You Have The Right Systems
If you’re serious about leveling up your scaling game, you need the right system, the right training, and the right team behind you. We're here to give you the exact tools and strategies top entrepreneurs use to dominate.

Discover the latest tips
View All.avif)
Chrysales was formed from the words "chrysalis" the stage where a caterpillar transforms into a butterfly and "sales".
It stands for one thing: sales transformation.Because scaling doesn’t happen by doing more of the same. Scaling only happens when you go through real transformation in your systems, your offer, team and the way you sell.
.avif)


