
Cost to hire a sales rep: salary, ramp and break-even deals
How much does it cost to hire a sales rep? A lot more than the salary on the offer letter. Count base pay and commission, employer taxes and benefits, the recruiting fee, software seats, your own coaching hours, and the ramp months when the rep costs money but closes little. Then divide the fixed first-year cost by what one average deal leaves you after commission, and you have the number of deals the rep must close just to break even.
If your pipeline can't feed that many deals in the first year, the hire isn't affordable yet, whatever the salary looks like. Every rate and price below is a reference point as of November 2026, not a quote for your situation and not tax advice. The worked example uses assumptions you replace with your own numbers.
What does a sales rep earn in salary and commission?
Official US medians put sales reps between about $70,000 and $105,000 a year, and the UK median for sales accounts and business development managers is £58,743. Most reps get a base salary plus commission or a bonus. Surveys of sales leaders show higher on-target earnings (OTE, base plus expected commission at plan), around $200,000 for account executives. Those surveys count only B2B companies whose sales leaders answer them, so don't read them as your market.
The US Bureau of Labor Statistics describes the usual pay mix in one line: "Most employers use a combination of salary and commissions or salary plus bonuses." Here is what the main published figures say and who they cover.
| Figure | Published by | Who it covers | Data date |
|---|---|---|---|
| $104,920 median annual wage | BLS | US wholesale and manufacturing reps, technical and scientific products | May 2025 |
| $72,080 median annual wage | BLS, same page | US wholesale and manufacturing reps, other products | May 2025 |
| $69,990 median annual wage | BLS | US sales reps of services, except advertising, insurance, financial services and travel | May 2025 |
| £58,743 median annual gross pay | ONS | UK full-time sales accounts and business development managers | 2026, provisional |
| £41,694 median annual gross pay | ONS, same table | UK full-time business sales executives | 2026, provisional |
| $200,000 median OTE | The Bridge Group | Account executives at 158 B2B companies, online survey | Q1-Q2 2026 |
| $80,000 median OTE ($55,000 base, $25,000 variable) | The Bridge Group | SDRs (reps who book meetings) at 351 B2B companies | 2025 report |
The rows differ because they count different people. The BLS and ONS figures count every employer in the occupation, from small distributors to large firms. The ONS figures only cover employees who have been in the same job for more than a year. The Bridge Group surveys sales leaders at 158 B2B companies and notes that its sample "skews toward organizations with engaged revenue leadership, which may not be representative of all B2B companies."
For Germany, an official sales-salary figure couldn't be verified at the time of writing, so use the salary you would actually offer. That advice holds everywhere: the benchmark tells you whether your offer is in a sane range, and your offer is the number that goes into the cost sheet.
How much of that pay should be base and how much commission is a separate design question. If you're tempted to go variable-only, read why commission-only reps rarely work before you write the offer.
What does a rep cost on top of salary?
On top of salary you pay employer taxes and benefits, a recruiting fee if you use an agency, software seats, and the hours you spend coaching the new rep. These are reference points as of November 2026, not tax advice. Employer costs add roughly a third in the US, around 16% in the UK on a salary near £58,000, and around 21% in Germany up to the contribution ceilings. Your payroll provider or tax adviser gives the real figure, and your own time belongs on the sheet too.
Employer taxes and benefits by country
These are official rates turned into a rough percentage on top of salary.
| Country | What the employer pays | Rough add-on to salary (as of November 2026) |
|---|---|---|
| US | Benefits were 24.7% of total compensation for "sales and related" workers ($8.86 of $35.85 an hour, June 2026), per BLS employer cost data. For all private industry the share is 30.0%. | About 33% on top of wages (our arithmetic: 8.86 / 26.99) |
| UK | Employer National Insurance of 15% on earnings above £5,000 a year in 2026/27 (gov.uk), plus a minimum 3% pension contribution on earnings between £6,240 and £50,270 (gov.uk). | About 16%: on £58,743 that is about £8,061 NI and £1,321 pension (our arithmetic), before the £10,500 Employment Allowance |
| Germany | Employers generally pay half of the pension (18.6%), health (14.6% plus an average 2.9% add-on), unemployment (2.6%) and care (3.6%) contributions. Care is split differently in Saxony. Rates per the health ministry and Deutsche Rentenversicherung. | About 21% up to the ceilings (health and care stop at €69,750 a year); accident insurance and levies come on top. Rates vary by situation, so check with your payroll provider |
The US group "sales and related" includes retail workers and cashiers, so treat the 33% as a broad average. If you offer good health insurance or a retirement match, your number will sit higher.
Recruiting, tools and your own time
Recruiting is cheap if you hire through your own network and expensive through an agency. SHRM's 2025 benchmarking survey of 2,371 members found a median cost per hire of $1,200 for nonexecutive roles, averaged over all hires. An agency costs far more: contingency recruiters commonly charge 15-25% of first-year salary, so ask yours for their rate. For a single sales hire through an agency, that fee is the number that matters.
Tools are the smallest line. As of November 2026, HubSpot Sales Hub Professional costs $90 per seat per month billed annually, plus a required $1,500 Professional Onboarding fee. LinkedIn Sales Navigator Core costs US$1,079.88 a year on annual billing, or US$119.99 a month on monthly billing, and the price may exclude VAT.
Your time is real money even though no invoice shows it. In a Bain Capital Ventures article, investor Joe DiMento reports that Albert Gozzi, CEO of Aleph, was on calls 3-4 hours a day for the first three months with new hires. Put a price on your hours and add them to the sheet.
Why vendor pages show much bigger totals
If you searched this topic, you saw "fully loaded" figures that look nothing like the official medians. Several of the pages that rank come from companies that sell outsourcing or recruiting. Their totals bundle assumptions you can't check, so compare them with care.
| Item | Totals on sales-side pages (seen in search results, November 2026) | Published survey or official data (different scope) |
|---|---|---|
| Account executive, fully loaded per year | About $203,000-$230,000+ for a full-time AE | $200,000 median OTE before employer costs (The Bridge Group); $70,000-$105,000 median pay for US sales reps overall (BLS) |
| SDR, fully loaded per year | About $105,000-$135,000 in year one | $80,000 median OTE before employer costs (The Bridge Group) |
| Cost of recruiting one hire | Agency fees commonly quoted at 15-25% of salary | $1,200 median cost per hire, nonexecutive roles (SHRM) |
Use your own cost sheet as the budget instead, filled in with your offer, your country's rates and your hours.
How long until a new rep pays for themselves?
Expect several months of pure cost before the first closed deals, and more months before the rep has paid back what you spent. The Bridge Group's 2026 survey puts average account executive ramp at 6.2 months. Your own sales cycle sets the pace: a rep can't close faster than your buyers decide, so take your cycle length and add the time a new person needs to learn your offer.
In his write-up of the 2026 data, Matt Bertuzzi of The Bridge Group calls 6.2 months the highest ramp time in the research's history. He also reports that 48% of reps achieved annual quota in 2026, down from 51% in 2024. For SDRs, who book meetings for others, the 2025 Bridge Group report found a 3.0-month ramp.
Don't just count the ramp months; look at the cash. Salary, employer costs, tools and your hours start in month one. Commission starts only when deals close, so a budget that books full OTE from day one overstates the early months and hides the real shape of the curve.
Tomasz Tunguz modeled this in 2014 with a six-month linear ramp. In his model a good hire paid back by month five, on a customer-lifetime-value basis. If the first hire failed and was replaced in month three, "the investment on sales hiring isn't recouped until 8 months after the initial hire." His model left out recruiting costs, so a real hire through an agency starts deeper in the hole.
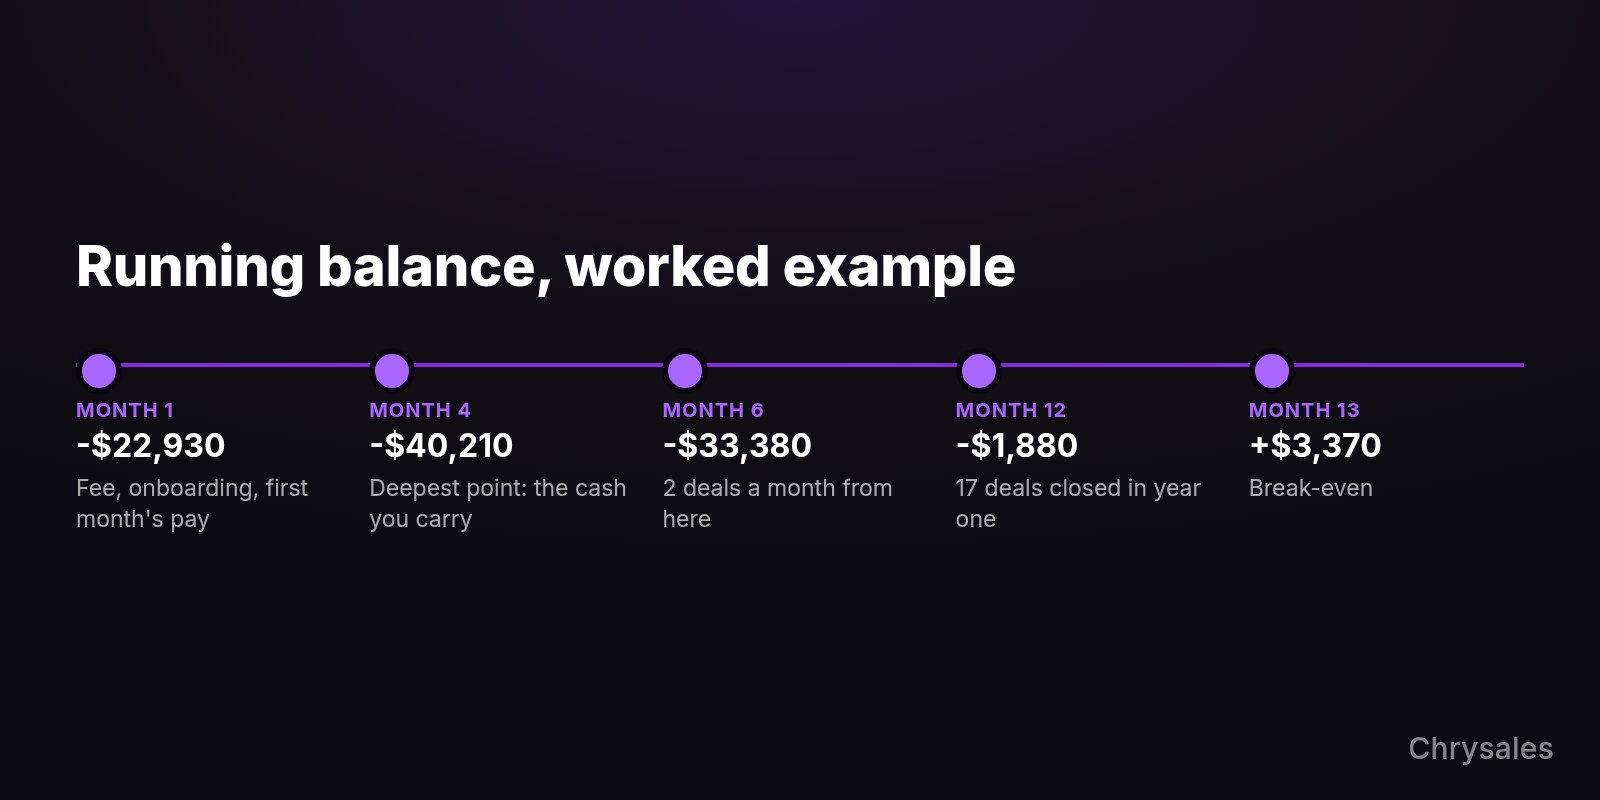
Here is the same idea with this post's worked example, which the break-even section breaks down line by line. Every input is an assumption: a $60,000 base and a $20,000 deal with 50% gross margin. The ramp is 0, 0, 0.5, 1 and 1.5 deals in months one to five, then 2 deals a month. Half a deal means one deal every two months on average.
| Month | Deals that month | Cumulative cost | Cumulative gross profit | Running balance |
|---|---|---|---|---|
| 1 | 0 | $22,930 | $0 | -$22,930 |
| 2 | 0 | $32,360 | $0 | -$32,360 |
| 3 | 0.5 | $43,120 | $5,000 | -$38,120 |
| 4 | 1 | $55,210 | $15,000 | -$40,210 |
| 5 | 1.5 | $68,630 | $30,000 | -$38,630 |
| 6 | 2 | $83,380 | $50,000 | -$33,380 |
| 9 | 2 | $127,630 | $110,000 | -$17,630 |
| 12 | 2 | $171,880 | $170,000 | -$1,880 |
| 13 | 2 | $186,630 | $190,000 | +$3,370 |
The table shows selected months; months 7 to 12 all run at 2 deals. Month one carries the $12,000 recruiting fee and the $1,500 HubSpot onboarding. The deepest point is month four at -$40,210, so that is the cash you must be able to carry without putting the company at risk. The rep closes 17 deals in year one and the balance turns positive in month 13.
Set a checkpoint before you start. Jason Lemkin of SaaStr suggests moving on if a rep shows no real progress by 1.5 sales cycles. Write that date down on the day the rep starts.
How many deals does a rep need to break even?
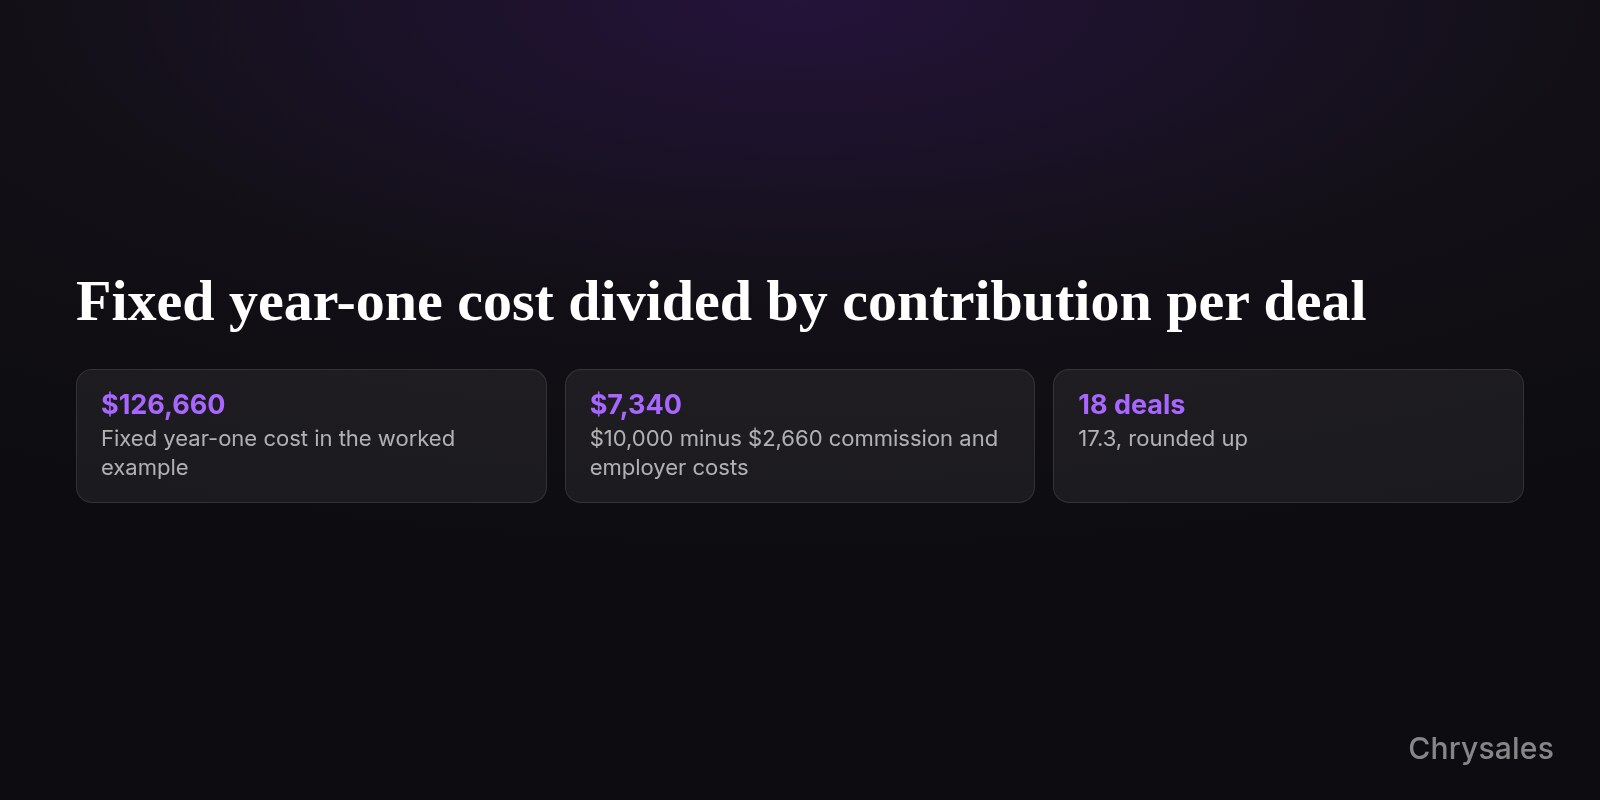
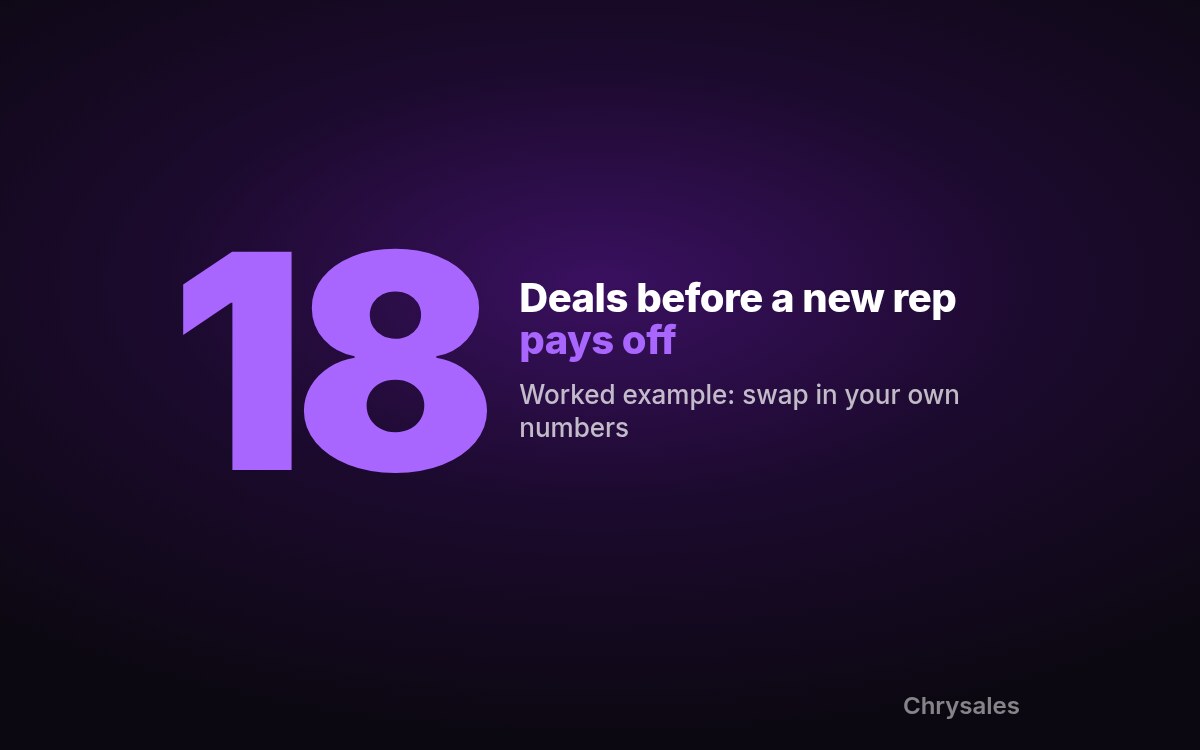
Divide the rep's fixed first-year cost by what each closed deal leaves you after the commission and the employer costs on it. For the worked example that is $126,660 divided by $7,340, or 17.3, so 18 deals. On the ramp above, the same rep closes 17 deals in year one, one short of 18, which is why the balance only turns positive in month 13.
The formula fits in a few lines:
Fixed year-one cost   = base salary
                      + employer costs on the salary
                      + recruiting fee
                      + tools for the year
                      + your hours x your hourly value

Contribution per deal = gross profit per deal
                      - commission per deal
                      - employer costs on that commission

Deals to break even   = fixed year-one cost / contribution per deal
                        (round up)
Contribution per deal is simply what each deal leaves you after paying the rep. Use gross profit per deal, not revenue. A $20,000 deal that costs you $10,000 to deliver only leaves $10,000 to pay the rep with.
Fill in your own cost sheet
Copy this into a spreadsheet or a note and replace every line with your own number:
YEAR-ONE COST SHEET: SALES REP

Base salary per year:                        ________
Employer costs (% of salary):                ________ %
  -> Salary + employer costs:                ________
Recruiting fee (agency % x base, or own):    ________
CRM seats for 12 months + onboarding:        ________
Prospecting tool for 12 months:              ________
Your coaching hours per week:                ________
  x 52 weeks x your hourly value:            ________
FIXED YEAR-ONE COST (sum of the lines):      ________

Average first-year deal value:               ________
Gross margin on that deal:                   ________ %
  -> Gross profit per deal:                  ________
Commission per deal:                         ________
  + employer costs on the commission:        ________
CONTRIBUTION PER DEAL (gross profit - both): ________

DEALS TO BREAK EVEN (fixed cost / contribution, round up): ________
The worked example, line by line
Every number below is an assumption you replace, except the 33% employer costs (BLS, US) and the tool prices (as of November 2026).
| Line | Worked example | Where it comes from |
|---|---|---|
| Base salary | $60,000 | Assumption |
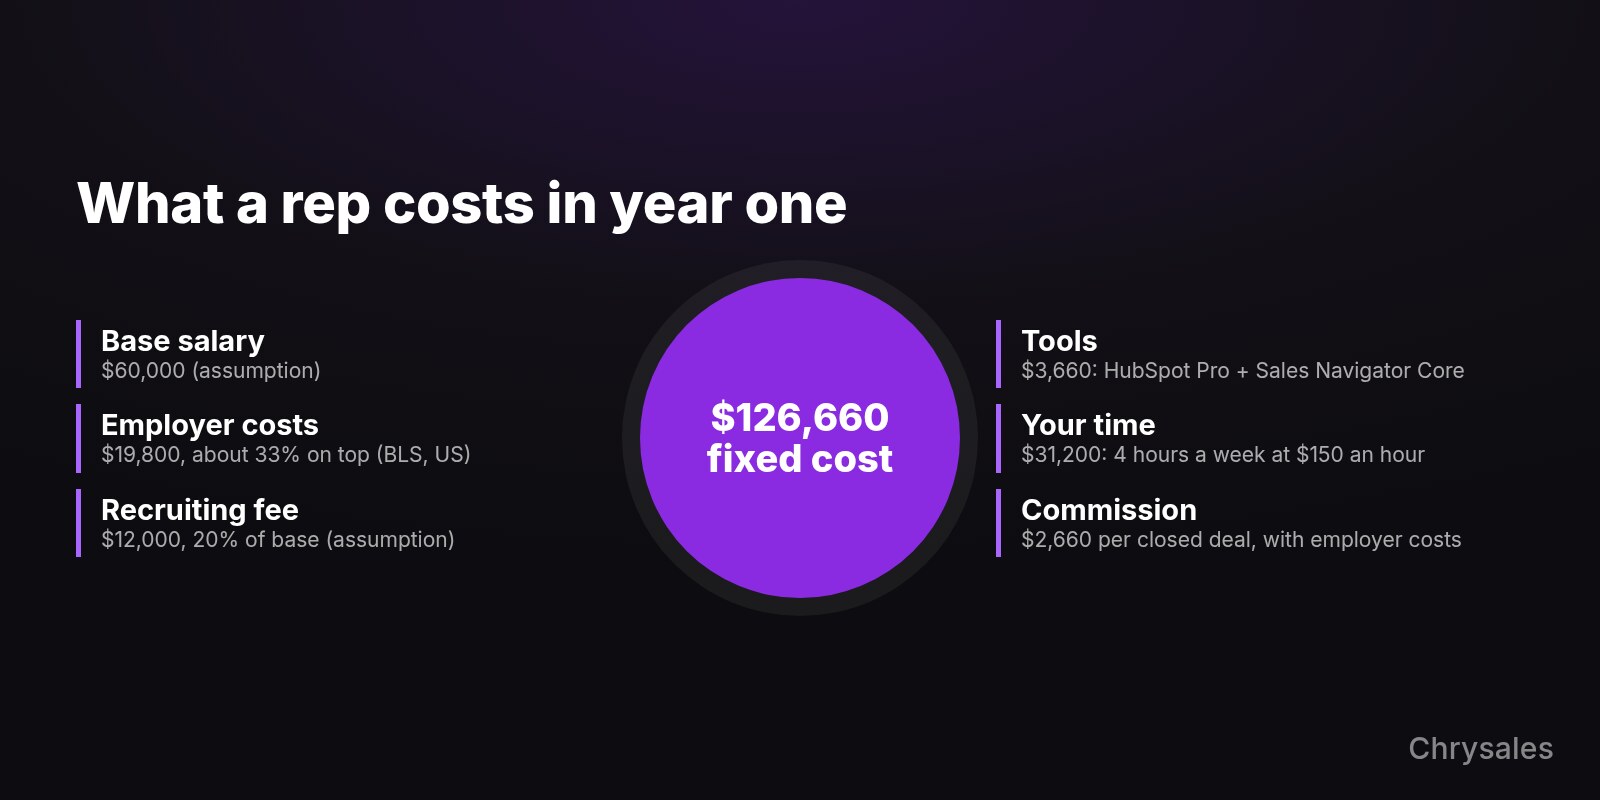
| Employer costs | $19,800 (33%) | US average for sales and related workers, BLS |
| Salary plus employer costs | $79,800 | Arithmetic |
| Recruiting fee | $12,000 | Assumption: 20% of base, inside the 15-25% recruiters quote |
| Tools | $3,660 | HubSpot Pro $90 x 12 + $1,500 onboarding + Sales Navigator Core $1,079.88 |
| Your time | $31,200 | Assumption: 4 hours a week x 52 weeks x $150 an hour |
| Fixed year-one cost | $126,660 | Sum |
| Deal value and gross profit | $20,000 deal, 50% margin = $10,000 | Assumption |
| Commission with employer costs | $2,000 (10%) + 33% = $2,660 | Assumption |
| Contribution per deal | $7,340 | $10,000 - $2,660 |
| Deals to break even | 17.3, so 18 | $126,660 / $7,340 |
To use the sheet on your own company:
- Enter the base salary you would actually offer, not a benchmark.
- Look up the employer rate for your country in the table above, or ask your payroll provider.
- Add the recruiting fee only if you will use an agency.
- Price the tools the rep will really use for twelve months, with any onboarding fees.
- Estimate your weekly coaching hours honestly and multiply by what an hour of your time is worth.
- Take gross profit from an average recent deal, then subtract the commission and the employer costs on it.
- Divide, round up, and you have your break-even deal count.
Check the result against quota benchmarks
Multiply your break-even deals by your average deal value. That's the minimum revenue the rep must close in year one, before the hire earns you anything. Compare it with what a new rep could realistically close in your market.
Benchmarks give a rough frame. Jason Lemkin writes that "In most SaaS companies, a sales rep's quota is, in the end, 3x-5x their OTE (i.e., salary + target bonus)." The Bridge Group's 2026 median is 4.6x. OnlyCFO adds a warning that applies to small companies too: "Having a good quota:OTE ratio is awesome but it means nothing if attainment is low."
First-year targets can be set lower on purpose. The same Bain Capital Ventures article reports that Mintlify, led by CEO Han Wang, set its first AE's quota at $500K instead of the typical $1.2M. A lower first-year target is honest planning, as long as your cash can carry the gap.
Can your pipeline feed a new rep?
Work backward from the deals. Divide the deals the rep must close by your close rate on qualified opportunities, and you get the number of opportunities someone must put in front of the rep. In the worked example, 17 deals at an assumed 20% close rate means 85 qualified opportunities in year one, about 7 a month. If you can't produce that today, fix lead flow before you hire.
Run the test with your own numbers:
- Take the deals the rep should close in year one, at least your break-even count.
- Pull your close rate on qualified opportunities from your CRM, using deals you closed recently.
- Divide the deals by the close rate to get the qualified opportunities needed per year.
- Divide by 12 for a monthly number.
- Compare it with the qualified opportunities your business produces now, after your own deals are taken care of.
If the monthly number is higher than what you produce, a closer will spend the ramp months prospecting instead of selling. Hiring a rep to get more meetings is usually the most expensive way to fix that. The description of Sabir's short video on this puts it in one line: "A sales rep should be closing deals, not searching for them."
Someone has to generate those opportunities. If that's the gap, decide which role to hire first, setter or closer, or compare the cost of an SDR or an appointment setting agency per held meeting.
Before you hire, it helps to see what a sales system looks like when it doesn't depend on adding people. This video of Sabir's covers building one that scales without a big team, including automation for outreach and lead management.
When is it too early to hire a sales rep?
It's too early when you can't yet describe how you win deals, when your pipeline can't feed the break-even number, or when you can't fund the months the rep runs negative. In our worked example that hole is $40,210 at its deepest and lasts until month 13. If any of these is true, fix it first or pick a cheaper route.
People who have been through it say the same thing in different words. Jesse Zhang, CEO of Decagon, put it this way in the Bain Capital Ventures piece: "You should only hire if founder sales are going well and you feel like it's getting repeatable." A commenter in a founder thread on Reddit gave the practical version: "Build out the sales process, management metrics, and comp plan before hiring."
Skipping those steps has a familiar result. A founder on r/Entrepreneur who had won over $1M in contracts in two years described the salaried sales hires that followed: "Pay them for months, they don't close anything." It's one anonymous account, so treat it as an illustration, not evidence.
Go through these questions in order and stop at the first "no":
- Have you closed enough deals yourself to describe how a typical one is won? If not, keep selling yourself for now.
- Is your sales process written down so someone else can follow it? If not, write it first; this is what to put in place before the first hire.
- Does your pipeline produce the qualified opportunities the rep needs (deals needed divided by your close rate)? If not, fix lead flow first, with outreach of your own or an SDR.
- Can you carry the deepest point of your ramp curve and keep paying until break-even month? If not, wait or lower the cost.
- Can you give the rep the coaching hours you put in the cost sheet? If not, the ramp will run longer than your plan.
- All yes? Hire, and set the checkpoint date on day one.
There are routes in between. A part-time senior seller can build the process before a full-time rep arrives; here is how to weigh a fractional sales leader against a full-time hire. Once the numbers work, move on to how to recruit and screen sales reps.
Common mistakes when budgeting for a sales hire
Most budgeting mistakes come from counting the salary and nothing else, then judging the rep too early or too late.
- Counting salary only. Add employer costs, the recruiting fee, tools and your hours; in the worked example a $60,000 base turns into $126,660 of fixed year-one cost.
- Booking full OTE from month one. Commission is paid on closed deals, so model it per deal and let the ramp curve show when it arrives.
- Running with no checkpoint. Lemkin's 1.5 sales cycles is one cut-off; pick yours and put the date in the calendar before the start date.
- Going commission-only to avoid the risk. It cuts your cost, but it can also shrink the pool of people who will take the job.
- Using a vendor's "fully loaded" total as your budget. Those ranges come from sales-side pages seen in search and mix very different roles.
- Forgetting your own hours. A new rep needs you on calls and in deal reviews for months, and those hours are hours you don't spend selling.
- Hiring a closer into an empty pipeline. Run the pipeline test before the break-even math, because a rep with nothing to work on can't close anything.
FAQ
How much does it cost to hire a sales rep in the first year?
Base salary plus about a third in the US, about 16% in the UK or about 21% in Germany for employer costs, plus recruiting, tools and your time. In our worked example, a $60,000 base becomes $126,660 of fixed cost before any commission. These are reference points, not tax advice; confirm the rates with your payroll provider or accountant and fill in the cost sheet with your own offer.
What is a normal commission for a B2B sales rep?
There is no single standard. Consultant Karl Sakas describes a more typical comp plan as "a base salary of, say, $75K or $100K" plus "a ~10% commission on the first year". Treat that as one consultant's starting point and check it against your gross margin.
How long does it take a new sales rep to ramp up?
The Bridge Group's 2026 survey puts average account executive ramp at 6.2 months, and SDRs at 3.0 months in its 2025 report. Your sales cycle matters more than any average. Plan for your cycle length plus learning time, and judge progress at about 1.5 cycles.
Is a commission-only sales rep cheaper?
On paper, yes, because you pay only when deals close. In practice it often fails, because a long sales cycle means months without pay for whoever accepts it. For wholesale and manufacturing reps, the BLS says most employers pay salary plus commission or bonus.
Should my first sales hire be an SDR or a closer?
It depends on where the gap is. If you have more qualified opportunities than you can handle, a closer pays back faster. If the pipeline test shows too few opportunities, someone has to generate them first, and a closer hired into an empty pipeline burns the ramp months.
Sources
- US Bureau of Labor Statistics - Wholesale and Manufacturing Sales Representatives, Occupational Outlook Handbook
- US Bureau of Labor Statistics - Data for Occupations Not Covered in Detail
- US Bureau of Labor Statistics - Employer Costs for Employee Compensation, June 2026
- US Bureau of Labor Statistics - ECEC Table 4, private industry by occupational group
- Office for National Statistics - ASHE Table 14, earnings by occupation
- gov.uk - Rates and thresholds for employers 2026 to 2027
- gov.uk - Workplace pensions: what you, your employer and the government pay
- Bundesgesundheitsministerium - Beiträge
- Deutsche Rentenversicherung - Werte der Rentenversicherung
- Barmer - Werte Sozialversicherung
- Pin - Recruitment agency commission structures
- SHRM - 2025 Recruiting Executives Benchmarking report (PDF)
- The Bridge Group - 2026 AE Models, Motions and Metrics
- The Bridge Group blog - 2026 AE compensation, quota and AI metrics
- The Bridge Group - 2025 SDR Models and Metrics report
- SaaStr - What's the relationship between OTE and quota
- SaaStr - How long should new account execs get to make quota
- OnlyCFO - Math to evaluate sales reps and GTM
- Tomasz Tunguz - Quantifying the cost of a bad hire
- Bain Capital Ventures - Founders: don't hire AEs until you've figured out how to sell yourselves
- Sakas and Company - Commission-only salesperson
- HubSpot - Sales Hub pricing
- LinkedIn - Sales Navigator plans
Want to know whether your pipeline can carry a rep before you sign the offer? On a free strategy call, you can talk through your hiring math with Chrysales. Check your hiring math on a free call
How much does it cost to hire a sales rep? A lot more than the salary on the offer letter. Count base pay and commission, employer taxes and benefits, the recruiting fee, software seats, your own coaching hours, and the ramp months when the rep costs money but closes little. Then divide the fixed first-year cost by what one average deal leaves you after commission, and you have the number of deals the rep must close just to break even.
If your pipeline can't feed that many deals in the first year, the hire isn't affordable yet, whatever the salary looks like. Every rate and price below is a reference point as of November 2026, not a quote for your situation and not tax advice. The worked example uses assumptions you replace with your own numbers.
What does a sales rep earn in salary and commission?
Official US medians put sales reps between about $70,000 and $105,000 a year, and the UK median for sales accounts and business development managers is £58,743. Most reps get a base salary plus commission or a bonus. Surveys of sales leaders show higher on-target earnings (OTE, base plus expected commission at plan), around $200,000 for account executives. Those surveys count only B2B companies whose sales leaders answer them, so don't read them as your market.
The US Bureau of Labor Statistics describes the usual pay mix in one line: "Most employers use a combination of salary and commissions or salary plus bonuses." Here is what the main published figures say and who they cover.
| Figure | Published by | Who it covers | Data date |
|---|---|---|---|
| $104,920 median annual wage | BLS | US wholesale and manufacturing reps, technical and scientific products | May 2025 |
| $72,080 median annual wage | BLS, same page | US wholesale and manufacturing reps, other products | May 2025 |
| $69,990 median annual wage | BLS | US sales reps of services, except advertising, insurance, financial services and travel | May 2025 |
| £58,743 median annual gross pay | ONS | UK full-time sales accounts and business development managers | 2026, provisional |
| £41,694 median annual gross pay | ONS, same table | UK full-time business sales executives | 2026, provisional |
| $200,000 median OTE | The Bridge Group | Account executives at 158 B2B companies, online survey | Q1-Q2 2026 |
| $80,000 median OTE ($55,000 base, $25,000 variable) | The Bridge Group | SDRs (reps who book meetings) at 351 B2B companies | 2025 report |
The rows differ because they count different people. The BLS and ONS figures count every employer in the occupation, from small distributors to large firms. The ONS figures only cover employees who have been in the same job for more than a year. The Bridge Group surveys sales leaders at 158 B2B companies and notes that its sample "skews toward organizations with engaged revenue leadership, which may not be representative of all B2B companies."
For Germany, an official sales-salary figure couldn't be verified at the time of writing, so use the salary you would actually offer. That advice holds everywhere: the benchmark tells you whether your offer is in a sane range, and your offer is the number that goes into the cost sheet.
How much of that pay should be base and how much commission is a separate design question. If you're tempted to go variable-only, read why commission-only reps rarely work before you write the offer.
What does a rep cost on top of salary?
On top of salary you pay employer taxes and benefits, a recruiting fee if you use an agency, software seats, and the hours you spend coaching the new rep. These are reference points as of November 2026, not tax advice. Employer costs add roughly a third in the US, around 16% in the UK on a salary near £58,000, and around 21% in Germany up to the contribution ceilings. Your payroll provider or tax adviser gives the real figure, and your own time belongs on the sheet too.
Employer taxes and benefits by country
These are official rates turned into a rough percentage on top of salary.
| Country | What the employer pays | Rough add-on to salary (as of November 2026) |
|---|---|---|
| US | Benefits were 24.7% of total compensation for "sales and related" workers ($8.86 of $35.85 an hour, June 2026), per BLS employer cost data. For all private industry the share is 30.0%. | About 33% on top of wages (our arithmetic: 8.86 / 26.99) |
| UK | Employer National Insurance of 15% on earnings above £5,000 a year in 2026/27 (gov.uk), plus a minimum 3% pension contribution on earnings between £6,240 and £50,270 (gov.uk). | About 16%: on £58,743 that is about £8,061 NI and £1,321 pension (our arithmetic), before the £10,500 Employment Allowance |
| Germany | Employers generally pay half of the pension (18.6%), health (14.6% plus an average 2.9% add-on), unemployment (2.6%) and care (3.6%) contributions. Care is split differently in Saxony. Rates per the health ministry and Deutsche Rentenversicherung. | About 21% up to the ceilings (health and care stop at €69,750 a year); accident insurance and levies come on top. Rates vary by situation, so check with your payroll provider |
The US group "sales and related" includes retail workers and cashiers, so treat the 33% as a broad average. If you offer good health insurance or a retirement match, your number will sit higher.
Recruiting, tools and your own time
Recruiting is cheap if you hire through your own network and expensive through an agency. SHRM's 2025 benchmarking survey of 2,371 members found a median cost per hire of $1,200 for nonexecutive roles, averaged over all hires. An agency costs far more: contingency recruiters commonly charge 15-25% of first-year salary, so ask yours for their rate. For a single sales hire through an agency, that fee is the number that matters.
Tools are the smallest line. As of November 2026, HubSpot Sales Hub Professional costs $90 per seat per month billed annually, plus a required $1,500 Professional Onboarding fee. LinkedIn Sales Navigator Core costs US$1,079.88 a year on annual billing, or US$119.99 a month on monthly billing, and the price may exclude VAT.
Your time is real money even though no invoice shows it. In a Bain Capital Ventures article, investor Joe DiMento reports that Albert Gozzi, CEO of Aleph, was on calls 3-4 hours a day for the first three months with new hires. Put a price on your hours and add them to the sheet.
Why vendor pages show much bigger totals
If you searched this topic, you saw "fully loaded" figures that look nothing like the official medians. Several of the pages that rank come from companies that sell outsourcing or recruiting. Their totals bundle assumptions you can't check, so compare them with care.
| Item | Totals on sales-side pages (seen in search results, November 2026) | Published survey or official data (different scope) |
|---|---|---|
| Account executive, fully loaded per year | About $203,000-$230,000+ for a full-time AE | $200,000 median OTE before employer costs (The Bridge Group); $70,000-$105,000 median pay for US sales reps overall (BLS) |
| SDR, fully loaded per year | About $105,000-$135,000 in year one | $80,000 median OTE before employer costs (The Bridge Group) |
| Cost of recruiting one hire | Agency fees commonly quoted at 15-25% of salary | $1,200 median cost per hire, nonexecutive roles (SHRM) |
Use your own cost sheet as the budget instead, filled in with your offer, your country's rates and your hours.
How long until a new rep pays for themselves?
Expect several months of pure cost before the first closed deals, and more months before the rep has paid back what you spent. The Bridge Group's 2026 survey puts average account executive ramp at 6.2 months. Your own sales cycle sets the pace: a rep can't close faster than your buyers decide, so take your cycle length and add the time a new person needs to learn your offer.
In his write-up of the 2026 data, Matt Bertuzzi of The Bridge Group calls 6.2 months the highest ramp time in the research's history. He also reports that 48% of reps achieved annual quota in 2026, down from 51% in 2024. For SDRs, who book meetings for others, the 2025 Bridge Group report found a 3.0-month ramp.
Don't just count the ramp months; look at the cash. Salary, employer costs, tools and your hours start in month one. Commission starts only when deals close, so a budget that books full OTE from day one overstates the early months and hides the real shape of the curve.
Tomasz Tunguz modeled this in 2014 with a six-month linear ramp. In his model a good hire paid back by month five, on a customer-lifetime-value basis. If the first hire failed and was replaced in month three, "the investment on sales hiring isn't recouped until 8 months after the initial hire." His model left out recruiting costs, so a real hire through an agency starts deeper in the hole.
Here is the same idea with this post's worked example, which the break-even section breaks down line by line. Every input is an assumption: a $60,000 base and a $20,000 deal with 50% gross margin. The ramp is 0, 0, 0.5, 1 and 1.5 deals in months one to five, then 2 deals a month. Half a deal means one deal every two months on average.
| Month | Deals that month | Cumulative cost | Cumulative gross profit | Running balance |
|---|---|---|---|---|
| 1 | 0 | $22,930 | $0 | -$22,930 |
| 2 | 0 | $32,360 | $0 | -$32,360 |
| 3 | 0.5 | $43,120 | $5,000 | -$38,120 |
| 4 | 1 | $55,210 | $15,000 | -$40,210 |
| 5 | 1.5 | $68,630 | $30,000 | -$38,630 |
| 6 | 2 | $83,380 | $50,000 | -$33,380 |
| 9 | 2 | $127,630 | $110,000 | -$17,630 |
| 12 | 2 | $171,880 | $170,000 | -$1,880 |
| 13 | 2 | $186,630 | $190,000 | +$3,370 |
The table shows selected months; months 7 to 12 all run at 2 deals. Month one carries the $12,000 recruiting fee and the $1,500 HubSpot onboarding. The deepest point is month four at -$40,210, so that is the cash you must be able to carry without putting the company at risk. The rep closes 17 deals in year one and the balance turns positive in month 13.
Set a checkpoint before you start. Jason Lemkin of SaaStr suggests moving on if a rep shows no real progress by 1.5 sales cycles. Write that date down on the day the rep starts.
How many deals does a rep need to break even?
Divide the rep's fixed first-year cost by what each closed deal leaves you after the commission and the employer costs on it. For the worked example that is $126,660 divided by $7,340, or 17.3, so 18 deals. On the ramp above, the same rep closes 17 deals in year one, one short of 18, which is why the balance only turns positive in month 13.
The formula fits in a few lines:
Fixed year-one cost   = base salary
                      + employer costs on the salary
                      + recruiting fee
                      + tools for the year
                      + your hours x your hourly value

Contribution per deal = gross profit per deal
                      - commission per deal
                      - employer costs on that commission

Deals to break even   = fixed year-one cost / contribution per deal
                        (round up)
Contribution per deal is simply what each deal leaves you after paying the rep. Use gross profit per deal, not revenue. A $20,000 deal that costs you $10,000 to deliver only leaves $10,000 to pay the rep with.
Fill in your own cost sheet
Copy this into a spreadsheet or a note and replace every line with your own number:
YEAR-ONE COST SHEET: SALES REP

Base salary per year:                        ________
Employer costs (% of salary):                ________ %
  -> Salary + employer costs:                ________
Recruiting fee (agency % x base, or own):    ________
CRM seats for 12 months + onboarding:        ________
Prospecting tool for 12 months:              ________
Your coaching hours per week:                ________
  x 52 weeks x your hourly value:            ________
FIXED YEAR-ONE COST (sum of the lines):      ________

Average first-year deal value:               ________
Gross margin on that deal:                   ________ %
  -> Gross profit per deal:                  ________
Commission per deal:                         ________
  + employer costs on the commission:        ________
CONTRIBUTION PER DEAL (gross profit - both): ________

DEALS TO BREAK EVEN (fixed cost / contribution, round up): ________
The worked example, line by line
Every number below is an assumption you replace, except the 33% employer costs (BLS, US) and the tool prices (as of November 2026).
| Line | Worked example | Where it comes from |
|---|---|---|
| Base salary | $60,000 | Assumption |
| Employer costs | $19,800 (33%) | US average for sales and related workers, BLS |
| Salary plus employer costs | $79,800 | Arithmetic |
| Recruiting fee | $12,000 | Assumption: 20% of base, inside the 15-25% recruiters quote |
| Tools | $3,660 | HubSpot Pro $90 x 12 + $1,500 onboarding + Sales Navigator Core $1,079.88 |
| Your time | $31,200 | Assumption: 4 hours a week x 52 weeks x $150 an hour |
| Fixed year-one cost | $126,660 | Sum |
| Deal value and gross profit | $20,000 deal, 50% margin = $10,000 | Assumption |
| Commission with employer costs | $2,000 (10%) + 33% = $2,660 | Assumption |
| Contribution per deal | $7,340 | $10,000 - $2,660 |
| Deals to break even | 17.3, so 18 | $126,660 / $7,340 |
To use the sheet on your own company:
- Enter the base salary you would actually offer, not a benchmark.
- Look up the employer rate for your country in the table above, or ask your payroll provider.
- Add the recruiting fee only if you will use an agency.
- Price the tools the rep will really use for twelve months, with any onboarding fees.
- Estimate your weekly coaching hours honestly and multiply by what an hour of your time is worth.
- Take gross profit from an average recent deal, then subtract the commission and the employer costs on it.
- Divide, round up, and you have your break-even deal count.
Check the result against quota benchmarks
Multiply your break-even deals by your average deal value. That's the minimum revenue the rep must close in year one, before the hire earns you anything. Compare it with what a new rep could realistically close in your market.
Benchmarks give a rough frame. Jason Lemkin writes that "In most SaaS companies, a sales rep's quota is, in the end, 3x-5x their OTE (i.e., salary + target bonus)." The Bridge Group's 2026 median is 4.6x. OnlyCFO adds a warning that applies to small companies too: "Having a good quota:OTE ratio is awesome but it means nothing if attainment is low."
First-year targets can be set lower on purpose. The same Bain Capital Ventures article reports that Mintlify, led by CEO Han Wang, set its first AE's quota at $500K instead of the typical $1.2M. A lower first-year target is honest planning, as long as your cash can carry the gap.
Can your pipeline feed a new rep?
Work backward from the deals. Divide the deals the rep must close by your close rate on qualified opportunities, and you get the number of opportunities someone must put in front of the rep. In the worked example, 17 deals at an assumed 20% close rate means 85 qualified opportunities in year one, about 7 a month. If you can't produce that today, fix lead flow before you hire.
Run the test with your own numbers:
- Take the deals the rep should close in year one, at least your break-even count.
- Pull your close rate on qualified opportunities from your CRM, using deals you closed recently.
- Divide the deals by the close rate to get the qualified opportunities needed per year.
- Divide by 12 for a monthly number.
- Compare it with the qualified opportunities your business produces now, after your own deals are taken care of.
If the monthly number is higher than what you produce, a closer will spend the ramp months prospecting instead of selling. Hiring a rep to get more meetings is usually the most expensive way to fix that. The description of Sabir's short video on this puts it in one line: "A sales rep should be closing deals, not searching for them."
Someone has to generate those opportunities. If that's the gap, decide which role to hire first, setter or closer, or compare the cost of an SDR or an appointment setting agency per held meeting.
Before you hire, it helps to see what a sales system looks like when it doesn't depend on adding people. This video of Sabir's covers building one that scales without a big team, including automation for outreach and lead management.
When is it too early to hire a sales rep?
It's too early when you can't yet describe how you win deals, when your pipeline can't feed the break-even number, or when you can't fund the months the rep runs negative. In our worked example that hole is $40,210 at its deepest and lasts until month 13. If any of these is true, fix it first or pick a cheaper route.
People who have been through it say the same thing in different words. Jesse Zhang, CEO of Decagon, put it this way in the Bain Capital Ventures piece: "You should only hire if founder sales are going well and you feel like it's getting repeatable." A commenter in a founder thread on Reddit gave the practical version: "Build out the sales process, management metrics, and comp plan before hiring."
Skipping those steps has a familiar result. A founder on r/Entrepreneur who had won over $1M in contracts in two years described the salaried sales hires that followed: "Pay them for months, they don't close anything." It's one anonymous account, so treat it as an illustration, not evidence.
Go through these questions in order and stop at the first "no":
- Have you closed enough deals yourself to describe how a typical one is won? If not, keep selling yourself for now.
- Is your sales process written down so someone else can follow it? If not, write it first; this is what to put in place before the first hire.
- Does your pipeline produce the qualified opportunities the rep needs (deals needed divided by your close rate)? If not, fix lead flow first, with outreach of your own or an SDR.
- Can you carry the deepest point of your ramp curve and keep paying until break-even month? If not, wait or lower the cost.
- Can you give the rep the coaching hours you put in the cost sheet? If not, the ramp will run longer than your plan.
- All yes? Hire, and set the checkpoint date on day one.
There are routes in between. A part-time senior seller can build the process before a full-time rep arrives; here is how to weigh a fractional sales leader against a full-time hire. Once the numbers work, move on to how to recruit and screen sales reps.
Common mistakes when budgeting for a sales hire
Most budgeting mistakes come from counting the salary and nothing else, then judging the rep too early or too late.
- Counting salary only. Add employer costs, the recruiting fee, tools and your hours; in the worked example a $60,000 base turns into $126,660 of fixed year-one cost.
- Booking full OTE from month one. Commission is paid on closed deals, so model it per deal and let the ramp curve show when it arrives.
- Running with no checkpoint. Lemkin's 1.5 sales cycles is one cut-off; pick yours and put the date in the calendar before the start date.
- Going commission-only to avoid the risk. It cuts your cost, but it can also shrink the pool of people who will take the job.
- Using a vendor's "fully loaded" total as your budget. Those ranges come from sales-side pages seen in search and mix very different roles.
- Forgetting your own hours. A new rep needs you on calls and in deal reviews for months, and those hours are hours you don't spend selling.
- Hiring a closer into an empty pipeline. Run the pipeline test before the break-even math, because a rep with nothing to work on can't close anything.
FAQ
How much does it cost to hire a sales rep in the first year?
Base salary plus about a third in the US, about 16% in the UK or about 21% in Germany for employer costs, plus recruiting, tools and your time. In our worked example, a $60,000 base becomes $126,660 of fixed cost before any commission. These are reference points, not tax advice; confirm the rates with your payroll provider or accountant and fill in the cost sheet with your own offer.
What is a normal commission for a B2B sales rep?
There is no single standard. Consultant Karl Sakas describes a more typical comp plan as "a base salary of, say, $75K or $100K" plus "a ~10% commission on the first year". Treat that as one consultant's starting point and check it against your gross margin.
How long does it take a new sales rep to ramp up?
The Bridge Group's 2026 survey puts average account executive ramp at 6.2 months, and SDRs at 3.0 months in its 2025 report. Your sales cycle matters more than any average. Plan for your cycle length plus learning time, and judge progress at about 1.5 cycles.
Is a commission-only sales rep cheaper?
On paper, yes, because you pay only when deals close. In practice it often fails, because a long sales cycle means months without pay for whoever accepts it. For wholesale and manufacturing reps, the BLS says most employers pay salary plus commission or bonus.
Should my first sales hire be an SDR or a closer?
It depends on where the gap is. If you have more qualified opportunities than you can handle, a closer pays back faster. If the pipeline test shows too few opportunities, someone has to generate them first, and a closer hired into an empty pipeline burns the ramp months.
Sources
- US Bureau of Labor Statistics - Wholesale and Manufacturing Sales Representatives, Occupational Outlook Handbook
- US Bureau of Labor Statistics - Data for Occupations Not Covered in Detail
- US Bureau of Labor Statistics - Employer Costs for Employee Compensation, June 2026
- US Bureau of Labor Statistics - ECEC Table 4, private industry by occupational group
- Office for National Statistics - ASHE Table 14, earnings by occupation
- gov.uk - Rates and thresholds for employers 2026 to 2027
- gov.uk - Workplace pensions: what you, your employer and the government pay
- Bundesgesundheitsministerium - Beiträge
- Deutsche Rentenversicherung - Werte der Rentenversicherung
- Barmer - Werte Sozialversicherung
- Pin - Recruitment agency commission structures
- SHRM - 2025 Recruiting Executives Benchmarking report (PDF)
- The Bridge Group - 2026 AE Models, Motions and Metrics
- The Bridge Group blog - 2026 AE compensation, quota and AI metrics
- The Bridge Group - 2025 SDR Models and Metrics report
- SaaStr - What's the relationship between OTE and quota
- SaaStr - How long should new account execs get to make quota
- OnlyCFO - Math to evaluate sales reps and GTM
- Tomasz Tunguz - Quantifying the cost of a bad hire
- Bain Capital Ventures - Founders: don't hire AEs until you've figured out how to sell yourselves
- Sakas and Company - Commission-only salesperson
- HubSpot - Sales Hub pricing
- LinkedIn - Sales Navigator plans
Want to know whether your pipeline can carry a rep before you sign the offer? On a free strategy call, you can talk through your hiring math with Chrysales. Check your hiring math on a free call
Scaling Is Not Hard If You Have The Right Systems
If you’re serious about leveling up your scaling game, you need the right system, the right training, and the right team behind you. We're here to give you the exact tools and strategies top entrepreneurs use to dominate.

Discover the latest tips
View All
Chrysales was formed from the words "chrysalis" the stage where a caterpillar transforms into a butterfly and "sales".
It stands for one thing: sales transformation.Because scaling doesn’t happen by doing more of the same. Scaling only happens when you go through real transformation in your systems, your offer, team and the way you sell.


